
Frequency Sweep
The user sets lower and upper frequencies, the amplitude of excitation, and number of cycles and time interval at each frequency. The excitation frequency is gradually incremented. At each frequency, the demand signal is compared with another signal of interest, for example, load, displacement, velocity or acceleration.
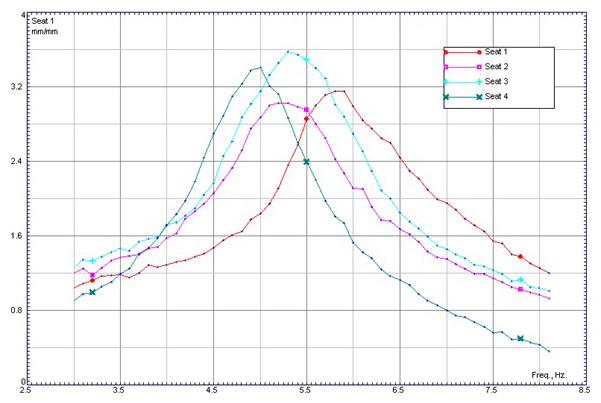
The resulting amplitude ratio versus frequency plot can be used to establish at where the resonance occurs. The natural frequency, ƒn, and the peak ratio at that frequency, pr, are calculated.